 These Last Days News - December 2, 2025
We
encourage everyone to share this web page with others, especially bishops
and clergy.
Visualizing the Declining Purchasing Power of the US Dollar...
MASSIVE DEPRESSION
"My child and My children, the
days will grow darker, and there will be hunger in your land. Yes, My child,
what I brought you here for this evening is to tell the world that there will be
a crash in the monetary doings of your government—an absolute crash that will
affect every man, woman, and child in the United States and Canada, and then,
like a serpent, creep all over Europe, until the world sees one big, massive
depression. I can illustrate to you, My children, what I mean by this monetary
depression." - Our Lady of the Roses, September
7, 1985
GATHER YOUR GRACES
"You cannot accept two masters.
One you will love, and the other you will learn to hate. And remember, My
children, where your treasures are, your heart will always lie. And better that
you gather your treasures in a place where there is neither rusting, nor attacks
by moths, and robbers cannot take them from you. Store your treasures in Heaven,
My children. Gather your graces. You must ransom your soul and the souls of your
children, your households. Do not wait expecting to be repatriated at the last
moment, My children. Many are coming across the veil unprepared, and, sadly,
they cannot be accepted into the Kingdom." -
Jesus, August 5, 1977
The above Messages from Our Lady were given to Veronica Lueken at Bayside, New York. Read more
ZeroHedge.com reported on December 2, 2025:
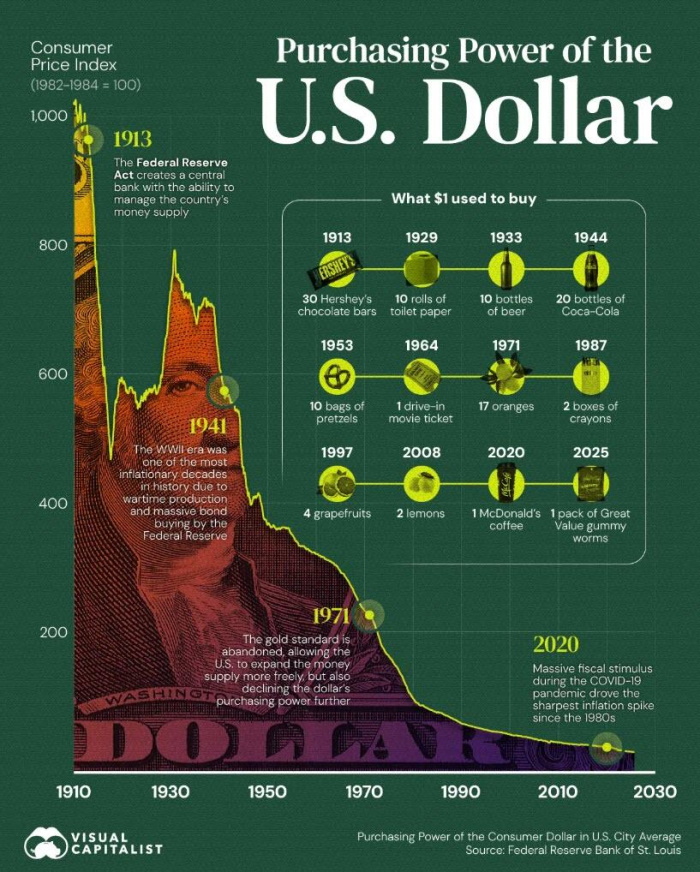
The U.S. dollar has steadily lost value over the past century. According to Federal Reserve data, the purchasing power of one dollar today is equal to just a few cents in 1913 (the year the Fed was created).
In this graphic, Visual Capitalist's Marcus Lu tracks the decline in the purchasing power of the U.S. dollar since the early 1900s, illustrating how inflation has eroded its value.
Data & Discussion
The data for this visualization comes from Federal Reserve Economic Data (FRED). It measures the “Purchasing Power of the Consumer Dollar” across all U.S. city averages, indexed to consumer prices.
The higher the index, the more purchasing power the dollar has. As the index declines, goods and services become relatively more expensive.
Date Purchasing Power of the Consumer Dollar in U.S. City Average 1913-01-01 1017.8 1914-01-01 994.2 1915-01-01 987.6 1916-01-01 956.2 1917-01-01 855 1918-01-01 715.9 1919-01-01 604.5 1920-01-01 517.7 1921-01-01 524.9 1922-01-01 590.2 1923-01-01 595 1924-01-01 578.8 1925-01-01 577.9 1926-01-01 557.3 1927-01-01 570.1 1928-01-01 578.8 1929-01-01 584.5 1930-01-01 584.5 1931-01-01 628.8 1932-01-01 699.1 1933-01-01 775.4 1934-01-01 755.7 1935-01-01 733.5 1936-01-01 722.8 1937-01-01 709.3 1938-01-01 702.4 1939-01-01 715.9 1940-01-01 717.7 1941-01-01 709.3 1942-01-01 638.1 1943-01-01 591.4 1944-01-01 574.3 1945-01-01 561.4 1946-01-01 549.2 1947-01-01 464.8 1948-01-01 421.4 1949-01-01 415.7 1950-01-01 424.4 1951-01-01 393.2 1952-01-01 377.4 1953-01-01 375 1954-01-01 370.8 1955-01-01 373.5 1956-01-01 372.6 1957-01-01 361.5 1958-01-01 349.3 1959-01-01 344.8 1960-01-01 340.6 1961-01-01 335.2 1962-01-01 332.8 1963-01-01 328.6 1964-01-01 323.2 1965-01-01 319.6 1966-01-01 313.6 1967-01-01 303.5 1968-01-01 293.3 1969-01-01 280.4 1970-01-01 264.3 1971-01-01 251.1 1972-01-01 243 1973-01-01 234.3 1974-01-01 214.3 1975-01-01 191.8 1976-01-01 179.6 1977-01-01 170.6 1978-01-01 159.8 1979-01-01 146.3 1980-01-01 128.4 1981-01-01 114.9 1982-01-01 105.9 1983-01-01 102.1 1984-01-01 98.2 1985-01-01 94.6 1986-01-01 91.3 1987-01-01 89.9 1988-01-01 86.4 1989-01-01 82.6 1990-01-01 78.5 1991-01-01 74.3 1992-01-01 72.4 1993-01-01 70.1 1994-01-01 68.4 1995-01-01 66.5 1996-01-01 64.8 1997-01-01 62.8 1998-01-01 61.9 1999-01-01 60.8 2000-01-01 59.2 2001-01-01 57.1 2002-01-01 56.5 2003-01-01 55 2004-01-01 54 2005-01-01 52.4 2006-01-01 50.4 2007-01-01 49.4 2008-01-01 47.4 2009-01-01 47.4 2010-01-01 46.1 2011-01-01 45.4 2012-01-01 44.1 2013-01-01 43.4 2014-01-01 42.8 2015-01-01 42.8 2016-01-01 42.2 2017-01-01 41.2 2018-01-01 40.3 2019-01-01 39.7 2020-01-01 38.8 2021-01-01 38.2 2022-01-01 35.6 2023-01-01 33.4 2024-01-01 32.4 2025-01-01 31.5 2025-09-01 30.8 Inflationary Eras and Economic Shocks
Major inflationary periods can be identified by looking at the steepest drops in the chart. For example, World War I and World War II strained government finances, leading to massive increases in public spending and money creation, which pushed prices sharply higher.
Similarly, the oil shocks of the 1970s caused energy costs to spike throughout the world, feeding into broad-based inflation. In each case, rising prices significantly eroded the purchasing power of the U.S. dollar.
From Gold Standard to Fiat Currency
Until 1971, the U.S. dollar was backed by gold.
This system was ended by President Nixon because the U.S. was creating more dollars than it had gold to support. Furthermore, foreign countries were increasingly demanding gold in exchange for their dollar reserves.
While ending this system gave policymakers more flexibility to manage the economy, money creation became easier, as shown by this chart of the M2 money supply. M2 comprises the most liquid forms of U.S. money, including physical currency, checking deposits, plus near-liquid assets like small-value time (CD) deposits, retail money-market funds, and other readily convertible savings vehicles.
An expanding money supply can be healthy when it grows in line with factors like population, economic output, and demand for credit, but becomes inflationary when it outpaces real economic growth.
Be sure to email this page to all your friends.
"The judgment of your God is not akin to the judgment of man. The Eternal Father will only judge by the heart. Your rank, your accumulation of worldly goods does not set you up before another. Many have sold their souls within the holy House of God. Better that you strip yourself and remove all worldly interests now while you have the time to make amends to your God, for many mitres will fall into hell." - St. Thomas Aquinas, August 21, 1972
![]() The
Virgin Mary's Bayside Prophecy Books are Now Available in E-book Version.
Click Here Now!
The
Virgin Mary's Bayside Prophecy Books are Now Available in E-book Version.
Click Here Now!
When you pray the Holy Rosary, you have Our Lady's hand in yours. When you pray the Holy Rosary, you have the power of God in your hands. Start now! Click here...
Our Lady of the Roses Awesome Bayside Prophecies... https://www.tldm.org/Bayside/ These prophecies came from Jesus, Mary, and the saints to Veronica Lueken at Bayside, NY, from 1968 to 1995.
Directives from Heaven... https://www.tldm.org/directives/directives.htm
D36 - Bishops (Part 1)
D37 - Bishops (Part 2)
D38 - Priests (Part 1)
D39 - Priests (Part 2)
D40 - Infiltrators
| Home - Latest News | Introduction | Bayside Prophecies | Directives from Heaven | Shopping Cart | Miracles & Cures | Veronica Lueken | Miraculous Photos | Bible | Radio Program | Bayside Videos |
The electronic form of this document is copyrighted.
Quotations are permissible as long as this web site is acknowledged with a
hyperlink to:
http://www.tldm.org
Copyright © These Last Days Ministries, Inc. 1996 - 2025 All rights
reserved.
P.O. Box 40
616-698-6448
Lowell, MI 49331-0040
Revised: December 02, 2025
